Simulates bivariate point process data
sim_pp_data_biv.RdSimulates a spatial point pattern with three cell types: background, immune1, and immune2.
Usage
sim_pp_data_biv(
  lambda_n,
  abundance,
  markvar1 = "immune1",
  markvar2 = "immune2",
  markvar3 = "background",
  distribution = "hom",
  clust = FALSE
)
Arguments
- lambda_n
Number of total cells in image
- abundance
Percentage intensity for marker positive cells
- markvar1
Marker positive cell type (default is "immune1")
- markvar2
Marker positive cell type (default is "immune2")
- markvar3
Marker negative cell type (default is "background")
- distribution
Determines whether the image is homogeneous ("hom") or inhomogeneous ("inhom")
- clust
Determines whether an image is simulated with or without clustering (TRUE/FALSE)
Value
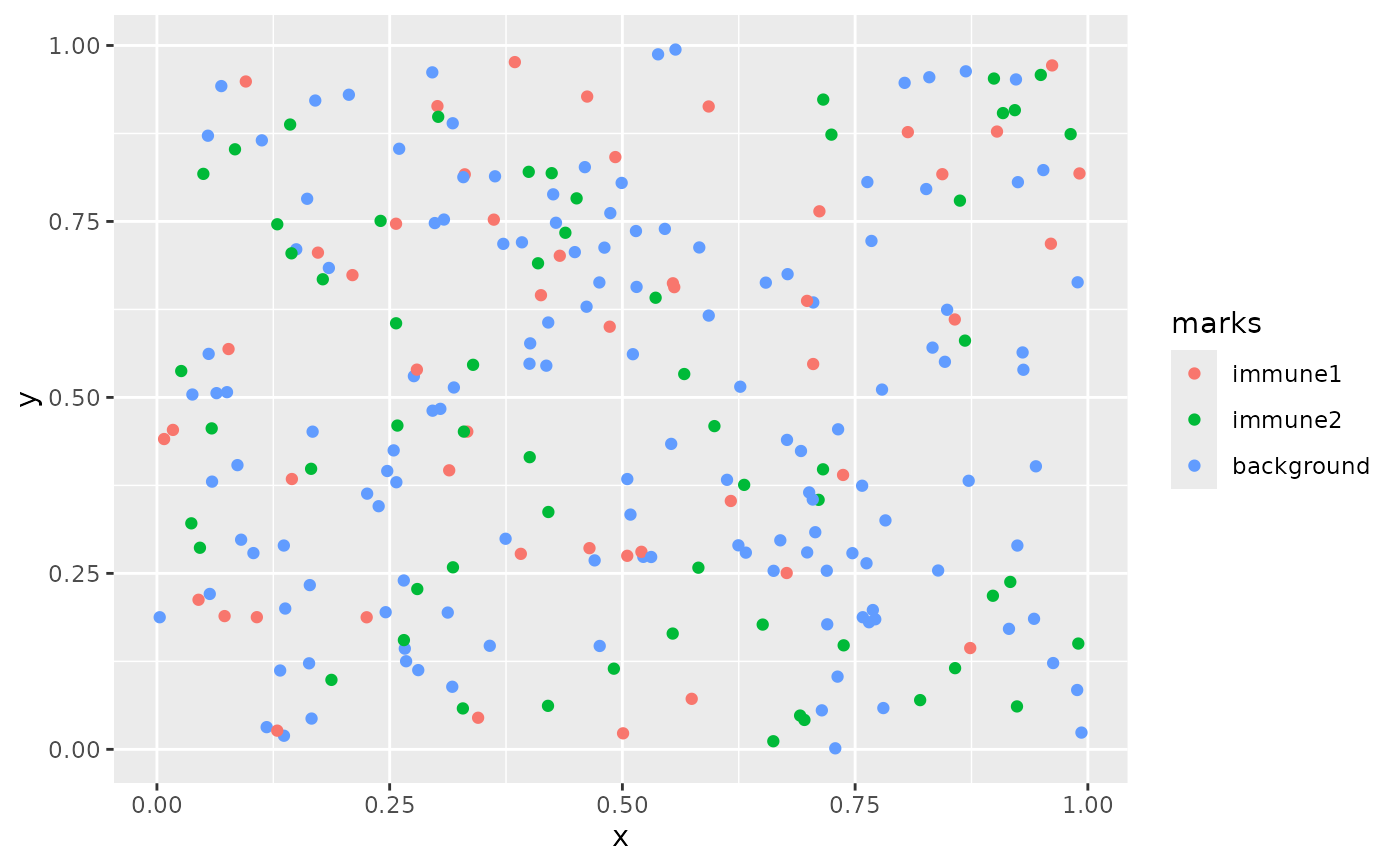
A point pattern object of class "ppp" from the spatstat package where the three cell types are background, immune1, and immune2.
Examples
if (requireNamespace("dplyr", quietly = TRUE) &&
   requireNamespace("ggplot2", quietly = TRUE) &&
   requireNamespace("tibble", quietly = TRUE) &&
   requireNamespace("magrittr", quietly = TRUE)) {
  pp_obj <- sim_pp_data_biv(lambda_n = 200, abundance = 0.3)
  magrittr::`%>%`(
  tibble::as_tibble(pp_obj),
  ggplot2::ggplot(ggplot2::aes(x, y, color = marks))
  ) +
  ggplot2::geom_point()
}